This post was imported from my old Drupal blog. To see the full thing, including comments, it's best to visit the Internet Archive.
Today, I’m going to moan about the lack of features in SPARQL that are necessary to do many kinds of data analysis and visualisation. Going from raw data, held in RDF, to data like
- the average traffic flow along the M5
- the total amount claimed by each MP
- the number of corporate insolvency notices published each day
cannot be done with SPARQL on its own. These calculations involve aggregation, grouping and projection which are planned for SPARQL vNext, but not here yet (at least, not in any standard way or in every triplestore).
Here’s the pretty graph to illustrate today’s rant:
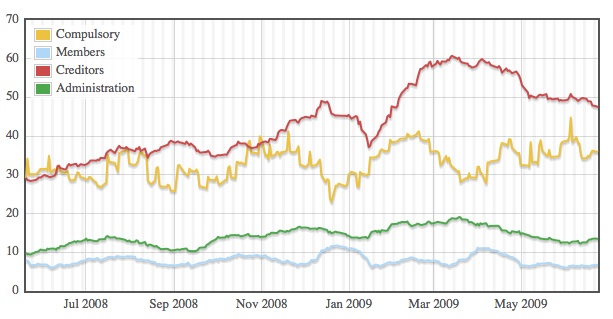
The graph shows the number of notices of certain types placed in the London Gazette each day. The notices it summarises are those related to companies being liquidated, indicated by:
- winding-up petitions indicating compulsory liquidation
- members resolutions for winding-up indicating members’ voluntary liquidation
- creditors resolutions for winding-up indicating creditors’ voluntary liquidation
- appointment of administrators indicating companies going into administration
The graph is a version of:
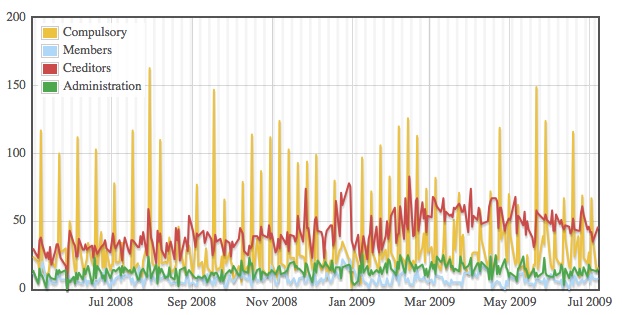
with each data point averaged over 20 days. (The raw data spikes every Wednesday, presumably due to notices building up over the weekend and taking two days to appear in the Gazette.) It shows how the number of creditors’ voluntary liquidations (indicating companies that go insolvent and are unable to pay their creditors) doubled from around 30/day in May 2008 to around 60/day in the Spring of this year, but seems to be falling again (as far as we can tell; the data is not up-to-date).
This data is brought to you by the RDFa embedded by TSO in the notices on the London Gazette website and the scraping of said data into the datagovuk datastore held on the Talis platform, for both of which we have OPSI to thank.
The visualisation is brought to you by a touch of experimental “AJAR” in rdfQuery and the graphing power of Flot. Here are the lengths I have to go to to get the pretty graph:
First, I use rdfQuery to request a list of London Gazette issues since 1st May 2008. The SPARQL for the request is:
PREFIX corp-insolvency: <http://www.gazettes-online.co.uk/ontology/corp-insolvency#>
PREFIX g: <http://www.gazettes-online.co.uk/ontology#>
PREFIX xsd: <http://www.w3.org/2001/XMLSchema#>

CONSTRUCT {
  ?issue a g:Issue .
  ?issue g:hasPublicationDate ?date .
}
WHERE {
  ?issue a g:Issue .
  ?issue g:hasPublicationDate ?date .
  FILTER ( ?date > "2008-05-01"^^xsd:date ) .
}
This is a CONSTRUCT request because the resulting RDF/XML can be loaded into rdfQuery for querying. I could do a SELECT query and request JSON as the output format, but I’m doing a kind of end-to-end RDF thing here. So I use rdfQuery to make the request, load the result into an rdfQuery object, query it, and iterate over the results.
For each of the returned issues (all 293 of them), I make a separate request for all the relevant notices within that issue. The SPARQL looks like this:
PREFIX corp-insolvency: <http://www.gazettes-online.co.uk/ontology/corp-insolvency#>
PREFIX g: <http://www.gazettes-online.co.uk/ontology#>

CONSTRUCT {
  ?notice a ?type
}
WHERE {
  ?notice g:isInIssue $issue .
  { ?notice a corp-insolvency:MembersResolutionsForWindingUpNotice } UNION
  { ?notice a corp-insolvency:CreditorsResolutionsForWindingUpNotice } UNION
  { ?notice a corp-insolvency:AppointmentOfAdministratorNotice } UNION
  { ?notice a corp-insolvency:PetitionsToWindUpCompaniesNotice } .
  ?notice a ?type .
}
Once I’ve got the RDF for those notices, I can use rdfQuery to select just those of a particular type, then count how many there are and use the result to plot the graph.
Creating the graph involves 294 requests to the Talis store via the proxy that I’m using to get around the cross-site scripting issues, each of which takes (in my experience) between 200ms and 4s. So it’s pretty server-intensive for both the Talis servers and my proxy server (which is why I’m not actually going to make the page available generally). It’s also slow.
What I want to do is to be able to make four SPARQL requests that return RDF that summarise the number of notices of each of the different types on each date (or in each issue). I want to write SPARQL queries that look something like:
PREFIX corp-insolvency: <http://www.gazettes-online.co.uk/ontology/corp-insolvency#>
PREFIX g: <http://www.gazettes-online.co.uk/ontology#>

CONSTRUCT {
  ?issue a g:Issue .
  ?issue g:hasPublicationDate ?date .
  ?issue corp-insolvency:membersResolutionsForWindingUpNotices COUNT(?notice) .
}
WHERE {
  ?issue a g:Issue .
  ?issue g:hasPublicationDate ?date .
  ?notice g:isInIssue ?issue .
  ?notice a corp-insolvency:MembersResolutionsForWindingUpNotice .
}
GROUP BY ?issue
Four requests would be so much better than 294.
The thing of it is that this kind of facility is available as standard in SQL, the Google Visualisation API’s simple query language, or in the “reduce” part of map/reduce. If we’re to think of triplestores as a serious alternative to either relational or non-relational databases, and SPARQL as a serious alternative to either SQL or NoSQL, then it really must support these operations. And Real Soon.
In the meantime, I think the lesson for the publishers of linked data is to provide aggregated values for the obvious kinds of aggregations that people might want to do over your data. In the London Gazette data, that would be the counts of the various kinds of notices it contains. In the traffic flow data it would be the average, minimum and maximum traffic flow over each of the measured days, at each hour over the known dates and overall for each point.
On a more philosophical note, it strikes me that the concept of aggregation contradicts the Open World assumption. I can only know that the number of members’ winding-up order notices was exactly 30 if I know that I know of all the members’ winding-up order notices that exist. Pragmatically, in many cases this is going to be just fine, because we know that the datasets that we’re using are complete (our World is Closed), but it does slightly concern me that it’s impossible to do much useful data analysis without contradicting one of the fundamental tenets of the Semantic Web.