Previously, in my quest to build an agent-based model for the information economy, I constructed a basic model and added trade to it, based on Wilhite’s Bilateral Trade and ‘Small-World’ Networks.
From doing that, we’ve seen that price stabilisation occurs over roughly the first 10 cycles, with about 38% of the 500 agents being pure producers, and about 5% only responding to trade requests from others.
There are a few parts of this model where I’ve made choices that might influence the outcome. To test these out, I want to do a sensitivity analysis to double-check that I’m not drawing unwarranted conclusions from single runs.
Setting up Repast to do multiple runs
Repast can be used to do batch runs of a particular model, spawning several instances with different starting conditions and therefore different end points.
Getting this working had a few false starts. Batch runs need to include code that stops the run after a set number of cycles. This code needs to be placed in the src/informationeconomy/context/SimBuilder.groovy file, which you don’t normally see when viewing the Package Explorer in Eclipse. Getting the simulation to stop after 20 iterations requires a simple line:
public class SimBuilder implements ContextBuilder {

	public Context build(Context context) {
        ...
		RunEnvironment.getInstance().endAt(20)
		...
	}
}
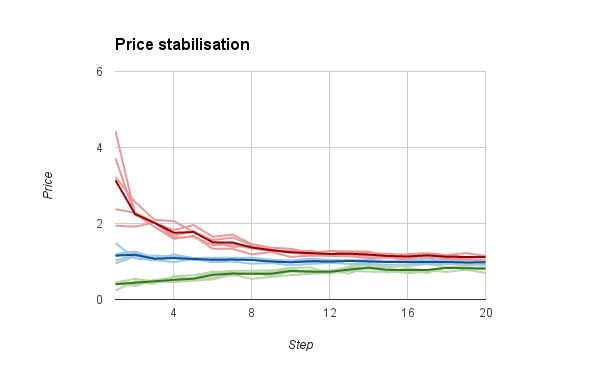
With that in place, the Batch Run Configuration tool enables you to run any number of concurrent “worlds”. I ran five with different random seeds. The following price stabilisation graph shows that they all reach price stabilisation after about eight iterations (pale lines are individual runs; stronger lines are the average over these runs):
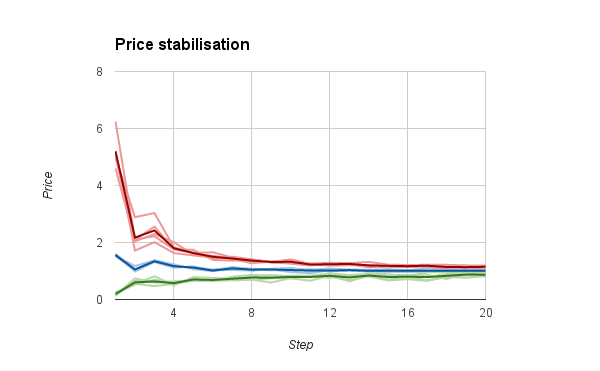
With 20 ticks per run, about 43% spend all their time producing goods and 57% trade in some way. About 6% never initiate trade themselves but just respond to offers from other agents.
Initial FOOD and GOLD
The first area where I want to carry out some sensitivity analysis is in the initial amount of FOOD and GOLD that each agent has. In the runs described above, each agent starts with the same amount of FOOD and GOLD that they can make in a turn. There are two other options that I want to test out: one where every agent starts with one FOOD and one GOLD, and one where each agent starts with a random amount of FOOD and GOLD (between 1 and 30).
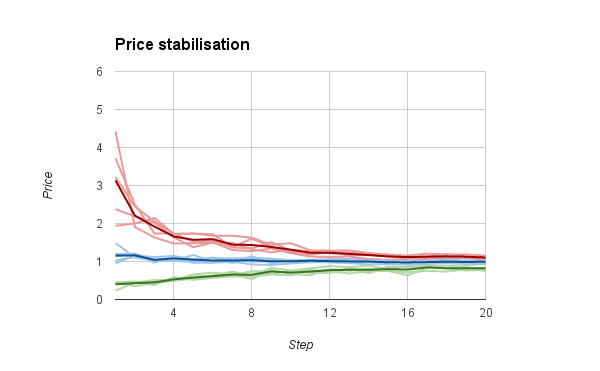
With all Firms initially having a random amount of FOOD and GOLD, there are slightly fewer pure producers (38%) and more Firms that only accept trades (10%). Prices don’t start as high and follow a smoother path to a later stabilisation (around 14 steps in), as shown here:
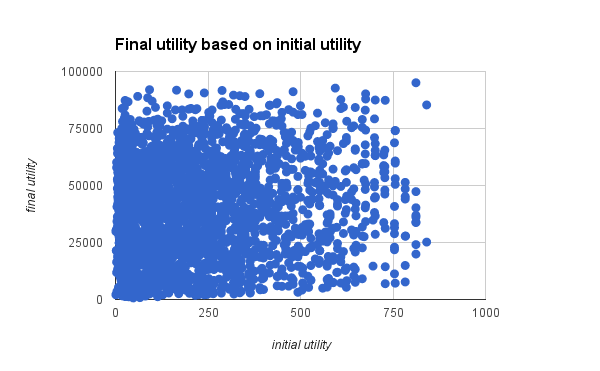
As we’d expect, there’s no relationship between initial utility and final utility when the Firms’ initial utility is unrelated to their ability to produce goods:
Starting with one FOOD and one GOLD leads to more trading, with only 30% pure producers and 17% of Firms only accepting trades. Prices start higher (after no trading in the first step) but settle down in the same way as with the other kinds of starting conditions.
Given the smoothness of the price stabilisation curve when Firms start with random amounts of FOOD and GOLD, I will use this version of the code going forward.
Randomising FOOD or GOLD production
On each step, each Firm currently has to decide whether to produce FOOD, produce GOLD, or trade. The code that determines which they choose to do has some built-in biases:
if (utilityMakingFood > utilityMakingGold) {
	if (trade['utility'] > utilityMakingFood) {
		action = makeTrade(trade)
	} else {
		currentFood += foodPerStep
		action = [ type: 'make', good: 'food', amount: foodPerStep, utility: currentUtility() ]
	}
} else if (trade['utility'] > utilityMakingGold) {
	action = makeTrade(trade)
} else {
	currentGold += goldPerStep
	action = [ type: 'make', good: 'gold', amount: goldPerStep, utility: currentUtility() ]
}
The Firm will only consider making FOOD if the utility of making it is greater than the utility of making GOLD. Similarly, it will only consider making a trade if the utility of trading is greater than producing either FOOD or GOLD. This should bias the Firms towards producing FOOD or GOLD, and specifically towards producing GOLD, all things being equal.
Under the initial configuration, where Firms begin with the amount of FOOD and GOLD that they can produce in a single step, 85% of Firms produce GOLD at some point, and 84% produce FOOD. Across the 5 runs, only 24 Firms produce only FOOD (never trading or producing GOLD), but even fewer produce only GOLD (2, over the 5 runs).
Under a randomised initial amount of FOOD and GOLD, 79% produce GOLD and 81% produce FOOD, with 41 only producing FOOD and 21 only producing GOLD over the 5 runs.
So I don’t think that the code is biasing the results towards the producing of GOLD, but it’s hard to tell whether it’s biasing away from trade. I’ve added a bit of randomness:
def randomlyTrue = random(10000) > 5000
if (utilityMakingFood > utilityMakingGold || (utilityMakingFood == utilityMakingGold && randomlyTrue)) {
	randomlyTrue = random(10000) > 5000
	if (trade['utility'] > utilityMakingFood || (trade['utility'] == utilityMakingFood && randomlyTrue)) {
		action = makeTrade(trade)
	} else {
		currentFood += foodPerStep
		action = [ type: 'make', good: 'food', amount: foodPerStep, utility: currentUtility() ]
	}
} else if (trade['utility'] > utilityMakingGold || (trade['utility'] == utilityMakingGold && randomlyTrue)) {
	action = makeTrade(trade)
} else {
	currentGold += goldPerStep
	action = [ type: 'make', good: 'gold', amount: goldPerStep, utility: currentUtility() ]
}
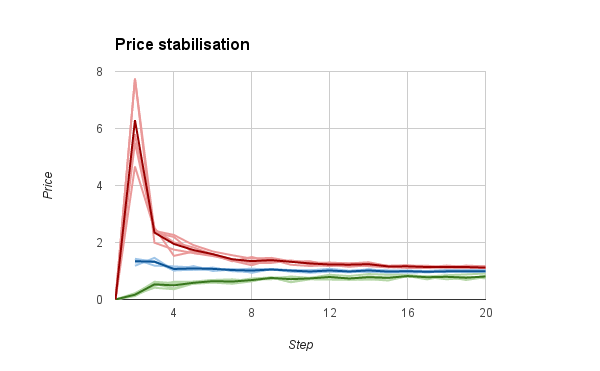
As anticipated, this makes very little difference. Over the five runs, one more Firm produces FOOD than previously, one more never trades, one more only produces FOOD and five more only produces GOLD. There is a more significant increase in the percentage of Firms that only receive (but do not initiate) trade, rising from 257 (10%) to 273 (11%).
Price stabilisation occurs as before, though the graph does show a more regular oscillation in maximum price over the first few ticks, compared to the slightly smoother trajectory shown in the previous graphs.
All in all, the model does not appear to be sensitive to the biases in the code that determine how Firms choose what to do on each step. I will keep the less biased code.
Next steps
Next, it’s time to introduce DATA to the mix. My goal for the initial experiment is simply to replace FOOD with DATA, use the same formula to work out the price for DATA, but introduce the crucial difference between FOOD and DATA, namely that when you trade DATA, you do not lose it. I want to see what happens to price stabilisation in this scenario, and look at the kinds of Firms that emerge.
Trying it out
As before, if you want to try out where I’ve got to so far, I’ve committed the source code to Github and there are instructions there about how to run it. Any comments/PRs will be gratefully received.
I’ve also put all the raw data generated from the runs described in this section in a spreadsheet which you’re welcome to copy and run your own analysis over.