It’s been a while since I gave an update about my attempt to build an agent-based model for the information economy. That’s partly because I got distracted crowdsourcing election candidate data and results for Democracy Club. It’s also partly because of this:

Image from Demetri Martin’s “This is a Book”
You may recall that I constructed a basic agent-based economic model and added trade to it, based on Wilhite’s Bilateral Trade and ‘Small-World’ Networks. Then I did some sensitivity analysis on it to check that the assumptions that I’d made in coding it all up weren’t changing the outputs in any major way.
My next step was to add DATA to the mix.In the process I realised that the model wasn’t mirroring reality sufficiently for me to be drawing conclusions from it.
Creating an economic model that includes data
Adding data to the agent-based model is pretty straight forward. It’s just the same as FOOD. Each firm has some initialData which it can supplement either by trading or by producing (based on its dataPerStep productivity) to update its currentData running total. A Firm’s utility is calculated as DATA x FOOD x GOLD rather than just FOOD x GOLD in the original scenario.
In my initial model, the price for DATA is calculated in the same way as the price for FOOD. This isn’t fair, however, because unlike with FOOD, when DATA is sold the seller doesn’t lose any DATA. (The impact of this essential difference between data and physical goods is the thing that I wanted to explore in these models.)
If we take the same example as I gave when added trade to the basic model, but this time with DATA rather than FOOD, this is how the trade works between a Firm that starts off with 30 GOLD and 5 DATA and a Firm that has 10 GOLD and 15 DATA. The price is set, as it would be if they were trading FOOD, to 2 GOLD for each DATA. At that price, the exchange goes like this:
| 30 | 5 | 150 | 6.00 | 10 | 15 | 150 | 0.67 |
| 28 | 6 | 168 | 4.67 | 12 | 15 | 180 | 0.80 |
| 26 | 7 | 182 | 3.71 | 14 | 15 | 210 | 0.93 |
| 24 | 8 | 192 | 3.00 | 16 | 15 | 240 | 1.07 |
| 22 | 9 | 198 | 2.44 | 18 | 15 | 270 | 1.20 |
| 20 | 10 | 200 | 2.00 | 20 | 15 | 300 | 1.33 |
| 18 | 11 | 198 | 1.64 | 22 | 15 | 330 | 1.47 |
In the original example, with FOOD, both Firms gain from the transaction up until 10 GOLD have been traded for 5 FOOD, at which point both have 20 GOLD, 10 FOOD and a utility of 200, an increase of 50 each. If they keep trading from that point their utility start to go down.
When DATA is involved, however, the Firm that is selling DATA does much better out of the transaction. Every step of the trade increases its utility because it is always simply adding GOLD rather than reducing its stock of DATA. So while the buyer’s utility rises from 150 to 200 in the trade, the seller’s utility doubles from 150 to 300.
Figuring out what a “fair price” for DATA would actually be, within this model, is something I want to come back to, but I thought I’d run the model with the price set in the same way as the price for FOOD is set, to give a baseline.
An economic model that includes data increases trading
Including data in the agent-based model does make some obvious changes. The first thing that’s really apparent is that compared to the FOOD-GOLD model, a lot more trading goes on.
In the FOOD-GOLD model, each Firm initiates an average of 1.25 trades, with a range of 0 to 12. Over the 5 runs, there are a total of 3182 trades.
In the DATA-FOOD-GOLD model, each Firm initiates an average of 3.54 trades over the 20 ticks, with a range of 0 to 14, with a total of 8893 trades over the 5 runs. This is biased heavily towards DATA trading, with each firm averaging 2.61 DATA trades (ranging from 0 to 13) and 0.93 FOOD trades (ranging from 0 to 7). About 74% of the trades that go on in this model involve DATA.
I realised having done this that the increase in trading could just be because there’s an additional good to trade, namely DATA. So I created an alternative COAL-FOOD-GOLD model where there’s again the additional good, but one that operates exactly like FOOD.
In the COAL-FOOD-GOLD model, each firm initiates an average of 1.59 trades, with a range of 0 to 15 and a total of 3971 trades over the 5 runs. As you’d expect, these are pretty evenly split between COAL and FOOD: 49% of the trades involve COAL.
So the increase in trading is partly due to there being more goods to trade, but mostly because of the unique nature of DATA.
Price stabilitsation with data trading
The price stabilisation graphs for food and for data are below.
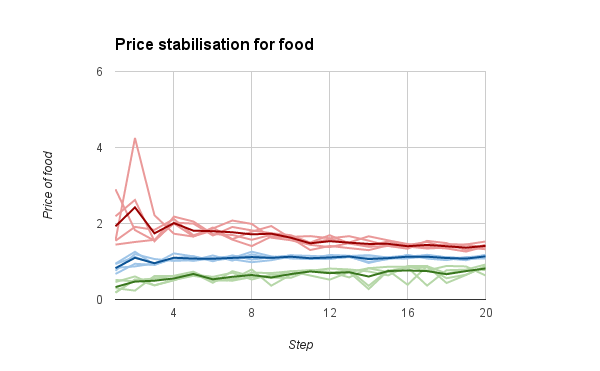
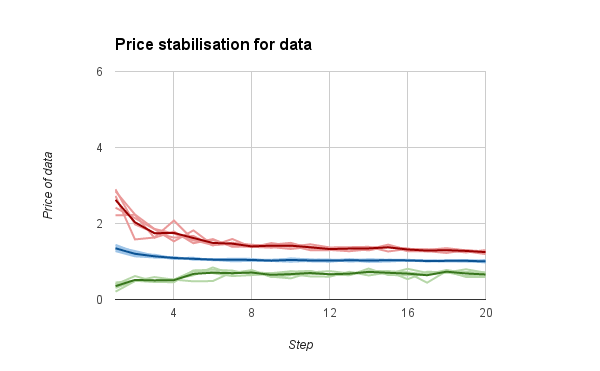
Both prices stabilise at around 1 GOLD over time, but the prices of FOOD are a lot more variable than those for DATA. My guess is that this is because there’s less trading of FOOD than there is trading for DATA.
A look at inequality
One of the things that I’m particularly keen to examine in this model is whether data being in the mix changes the inequality in the set of Firms in the economy.
One thing to examine here is the relationship between the initial utility of each Firm and the final utility of each firm. In this version of the model, the initial utility is randomised (rather than being based on how much the Firm can produce, or all being initially equal). You’d expect a small correlation between what you start with and what you end up with, but not a large one as 20 steps is plenty of time to trade or produce your way out of your starting position. Here are the correlations:
| model | correlation |
|---|---|
| FOOD-GOLD | 11% |
| COAL-FOOD-GOLD | 19% |
| DATA-FOOD-GOLD | 23% |
So there’s some evidence there that organisations that when data is added to the mix, the starting condition of each Firm is more influential than it would otherwise be, but it’s still not a very strong correlation.
The other thing I looked at were Gini coefficients of the economy, which is a measure of how unequal a society is, with 0% being perfect equity and 100% perfect inequality (one person having all the wealth). (For reference, the UK’s Gini coefficient is about 34%.)
| model | initial Gini coefficient | final Gini coefficient |
|---|---|---|
| COAL-FOOD-GOLD | 56% | 33% |
| DATA-FOOD-GOLD | 56% | 36% |
The Gini coefficients are roughly the same. But the thing about this result that makes me question whether the model is accurate is the fact that the Gini coefficients are decreasing from the initial state to the final state. This isn’t the case in the UK or the US, for example, where inequality is growing, and if you look at the global Gini index you’ll see it’s been increasing over time.
If the Gini coefficient in the model is decreasing, that’s a sign that the model isn’t properly reflecting inequalities that arise in real economies. That would probably be fine if I didn’t want explicitly to study inequalities. Given I do, it feels like I have to refine the model a bit more to make it better reflect reality so that we can draw conclusions from it.
Next steps
First, I need to add a mechanism to the model to measure the Gini coefficient over time. I’m currently only measuring the Gini coefficient at the very beginning (where wealth distribution is randomised) and at the very end (after 20 ticks of trading). It might be that the Gini coefficient goes down rapidly during the price stabilisation phase and then starts increasing, and therefore the model is accurately reflecting the increase of the Gini coefficient over time, once it gets going. I need to monitor it on each tick in order to work that out.
Then, if the Gini coefficient isn’t increasing, I need to add some mechanisms to the mix that are likely to increase inequality. Things that I’ve thought of are:
- reducing FOOD and/or GOLD by a fixed amount each tick, to mirror the minimum expenses a Firm incurs simply for existing; if I do this I have to add the possibility of Firms failing (and new Firms being created) or going into debt
- adding a mechanism that enables those Firms that have more GOLD to get more GOLD, for example by lending at interest to other Firms or by investing in increasing their own productivity
- breaking up the economy into smaller sub-economies that only trade with each other, with some connecting Firms that can trade across those sub-economies; this was a variant in Wilhite’s original paper but I don’t know if it had an effect on inequality
If you have any other ideas, let me know.
Trying it out
As before, if you want to try out where I’ve got to so far, I’ve committed the source code to Github and there are instructions there about how to run it. Any comments/PRs will be gratefully received. The code is quite messy now and could do with a refactor.
I’ve also put all the raw data generated from the runs described in this post in spreadsheets. These are:
Feel free to copy and create your own analyses if you don’t want to run the models yourself.