HTML5/RDFa Arguments
When I came back from holiday, I caught up with the recent discussions around RDFa and HTML5. It’s exhausting reading so many posts repetitively reiterating the positions of people who all have the best of intentions but fundamentally different priorities. And such a shame that so much energy is spent on fruitless discussion when it could be spent at the very least improving specifications, if not testing, implementing, experimenting or otherwise in some very minor way changing the world.
Offence Hierarchy Visualisation with rdfQuery and JIT
The Home Office recently opened up some of its data, mostly in the form of PDF reports and Excel spreadsheets. Right after, I went on holiday and offline (!) for a week, so I set myself the task of putting together some visualisations of the data using two client-side visualisation libraries that I liked the look of:
- jQuery sparklines which I think look simply gorgeous and which follow the jQuery tradition of being incredibly easy to put on a page
- the JavaScript InfoVis Toolkit (JIT) which can be used to create some very attractive and interactive visualisations for hierarchical information
As a quick summary, I ended up with solutions that use an HTML page with rdfQuery code that pulls in static RDF/XML files and performs queries on them to create the particular formats that the two client-side libraries require.
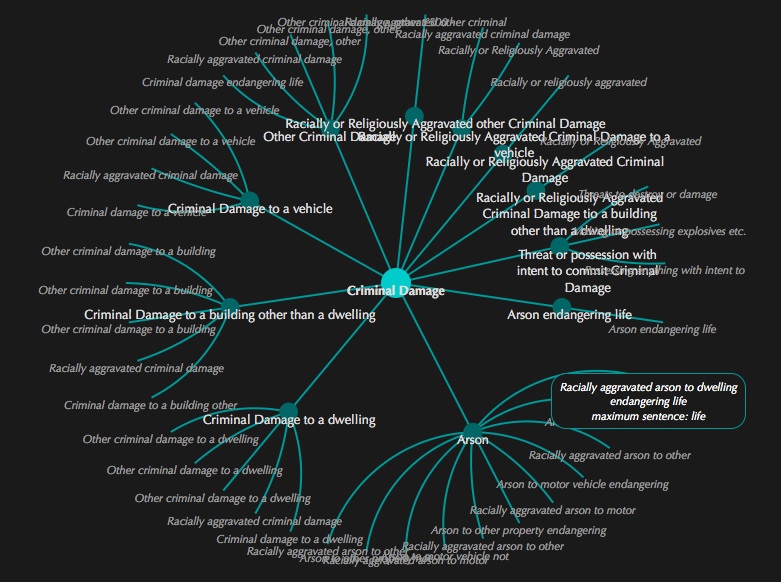
The first one I’m going to talk about is a visualisation of types of offences using JIT. There’s a screenshot below to give you a flavour, but you’d be better off actually visiting the page because it’s interactive: mousing over and clicking on the labels enables you to navigate around the hierarchy.
Semantic Technologies at the XML Summer School
I posted before about the joys of the XML Summer School: the learning, the punting, the drinking! Now the Semantic Technologies track has been fleshed out to include:
- Bob DuCharme giving an overview on the semantic web
- Leigh Dodds talking about publishing linked data
- Andy Seabourne talking about SPARQL
- Duncan Hall talking about creating ontologies
It’s not really XML, I suppose, but it’s certainly a bunch of interesting and timely topics. I particularly hope that we’ll get some public sector people in the room so that we can discuss some of the challenges and opportunities in that area.
SPARQL & Visualisation Frustrations: Linked Data
I’ll start with the problem. To create the graphs I showed in my last post, I wanted to split MPs into groups based on their party affiliation. Ideally, I wanted the Google Visualisation query to look like:
select mp, additionalCosts, totalTravel, totalBasic
where party = 'Conservative'
order by totalClaim desc
limit 25
because this is reasonably easy to understand and for a developer to create without having to know any magic URIs.
The party affiliation for an MP is given in the RDF supplied within the Talis store as a pointer to one of the resources:
http://dbpedia.org/resource/Labour_Party_(UK)http://dbpedia.org/resource/Conservative_Party_(UK)http://dbpedia.org/resource/Liberal_Democrats
Now, if you visit http://dbpedia.org/resource/Conservative_Party_(UK) then you’ll see precious few properties and none of them give you access to the string ‘Conservative’. If you look at http://dbpedia.org/resource/Liberal_Democrats, you’ll see plenty of properties, one of which is dbpprop:partyName. But trying to query on dbpprop:partyName within the Talis data store gives me nothing, because that information hasn’t been imported into the particular store that this SPARQL query is running on.
SPARQL & Visualisation Frustrations: RDF Datatyping
My last post showed a visualisation of the Guardian’s MP’s Expenses data, ported into a Talis triplestore. Here’s a screenshot of another one (follow the link for the interactive version). The files that are used to create it are attached to this post.
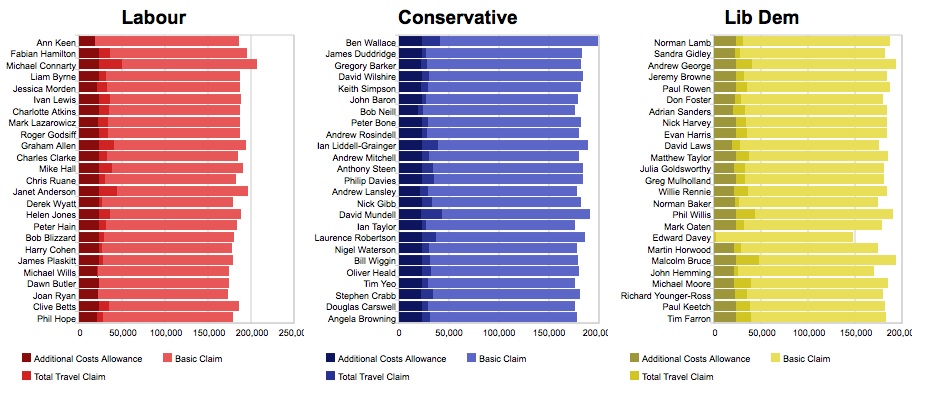
There are several things that are frustrating about creating these visualisations, which I want to discuss because I think they lead to some lessons about what data publilshers and members of the semantic web community should do to make these things easy. The first thing I want to talk about is datatyping.